Early signs of a short-term recovery
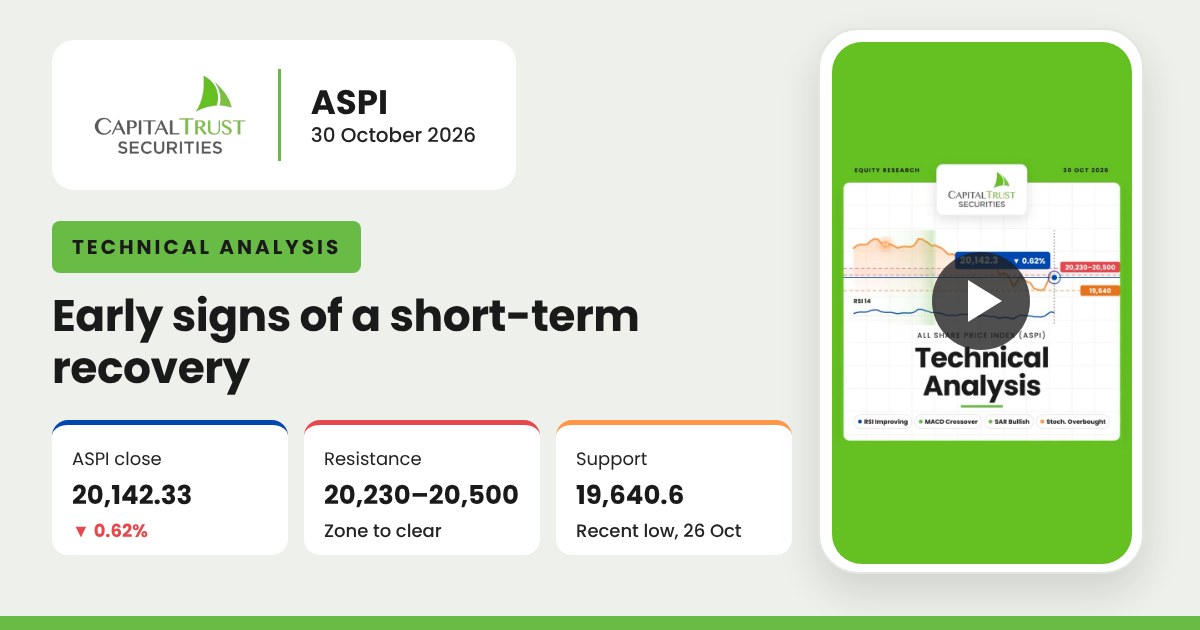
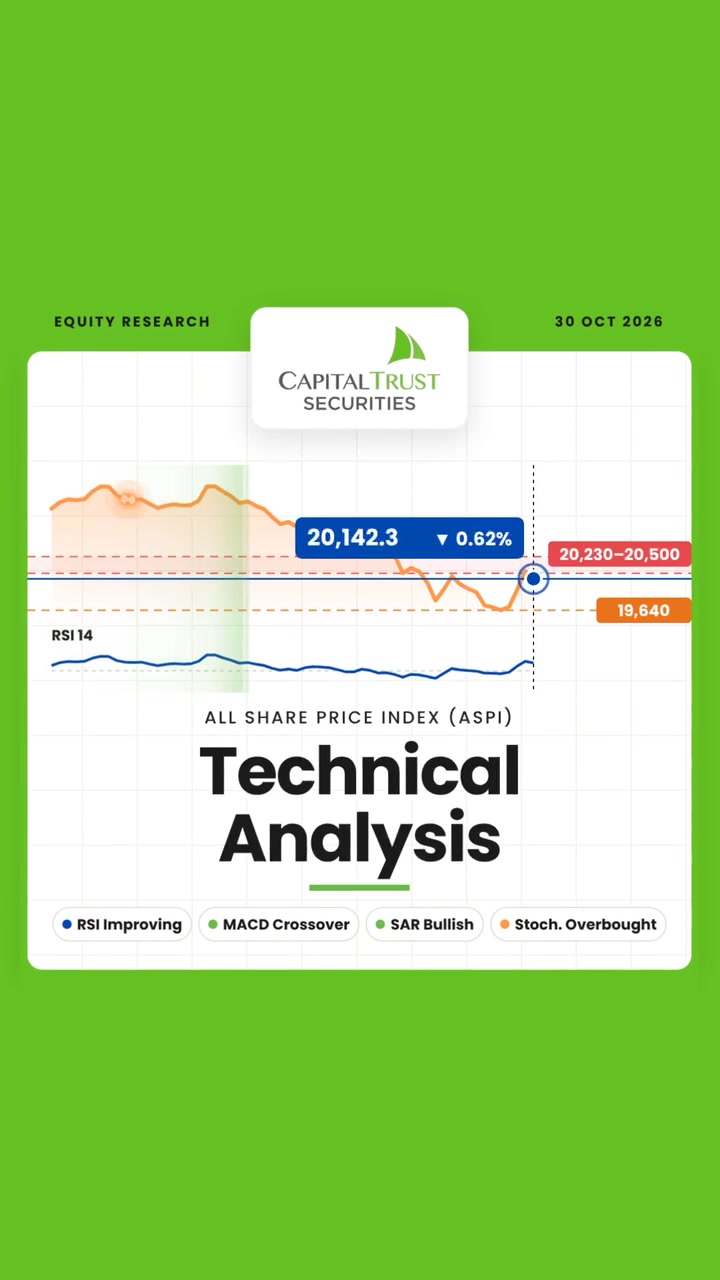
The ASPI is showing early signs of a short-term recovery, supported by improving RSI and MACD readings and a bullish shift in the Parabolic SAR. The Stochastic RSI is overbought, suggesting possible near-term consolidation.
ASPI 20,142.33▼ 0.62%
RSI improvingMACD crossoverSAR bullishStochastic RSI overbought
Support19,640.6
Resistance20,230–20,500
Video1:45